Configuring test suites
In Test Analytics, a test suite is a collection of tests. A suite has a run, which is the execution of tests in a suite. A suite's run is analogous to a pipeline's build.
Many organizations set up one suite per test framework, for example one suite for RSpec, and another suite for Jest. Others use a common standard, such as JUnit XML, to combine tests from multiple frameworks to set up custom backend and frontend suites.
Each suite inside Test Analytics has a unique API token that you can use to route test information to the correct suite. Pipelines and test suites do not need to have a one-to-one relationship.
To delete a suite, or regenerate its API token, go to suite settings.
Parallelized builds
Test Analytics works even when your test runs are split across different agents by de-duplicating against the Test Analytics API token and unique build identifier.
The information that serves as a unique build identifier differs between CI environments. For details, see run_env[key] environment variables on our CI environments page.
Compare across branches
All test suites have a default branch so you can track trends for your most important codebase, and compare it to results across all branches.
Organizations typically choose their main production branch as their default, although this is not required.
To change your default branch, go to suite settings. You can also filter Test Analytics views by any branch by typing its name into the branch query parameter in the Test Analytics URL.
Detecting flaky tests
Flaky tests are automated tests that produce inconsistent or unreliable results, despite being run on the same code and environment. They cause frustration, decrease confidence in testing, and waste time while you investigate whether the failure is due to a genuine bug.
Test Analytics detects flaky tests by surfacing when the same test is run multiple times on the same commit SHA with different results. The tests might run multiple times within a single build or across different builds. Either way, they are detected as flaky if they report both passed and failed results.
If your test suite supports it, we recommend enabling the option to retry failed tests automatically. Automatic retries are typically run more often and provide more data to detect flaky tests. If you can't use automatic retries, Test Analytics also detects flaky tests from manual retries.
Alternatively, you can create scheduled builds to run your test suite on the default branch. You can schedule them outside your typical development time to run the test suite multiple times against the same commit SHA. You can still enable test retries in this setup, but they're less important. The more builds you run, the more likely you'll detect flaky tests that fail infrequently.
Test Analytics reviews the test results to detect flaky tests after every test run.
Tracking reliability
Test Analytics calculates reliability of both your entire test suite and individual tests as a measure of flakiness over time.
Reliability is defined as percentage calculated by:
- Test suite reliability =
passed_runs / (passed_runs + failed_runs) * 100 - Individual test reliability =
passed_test_executions / (passed_test_executions + failed_test_executions) * 100
Other test execution results such as unknown and skipped are ignored in the test reliability calculation.
In Test Analytics, a run is marked as failed as soon as a test execution fails, regardless of whether it passes on a retry. This helps surface unreliable tests. You can have a situation where a build eventually passes on retry in a Pipeline, and the related run is marked as failed in Test Analytics.
Trends and analysis
Once your test suite is set up, you'll have many types of information automatically calculated and displayed to help you surface and investigate problems in your test suite.
For individual tests, views include trend information on reliability, test execution count, test execution duration at p50 and p95, along with detailed information about flaky and failed test executions.

Select any individual test execution to see more trend and deep-dive information.

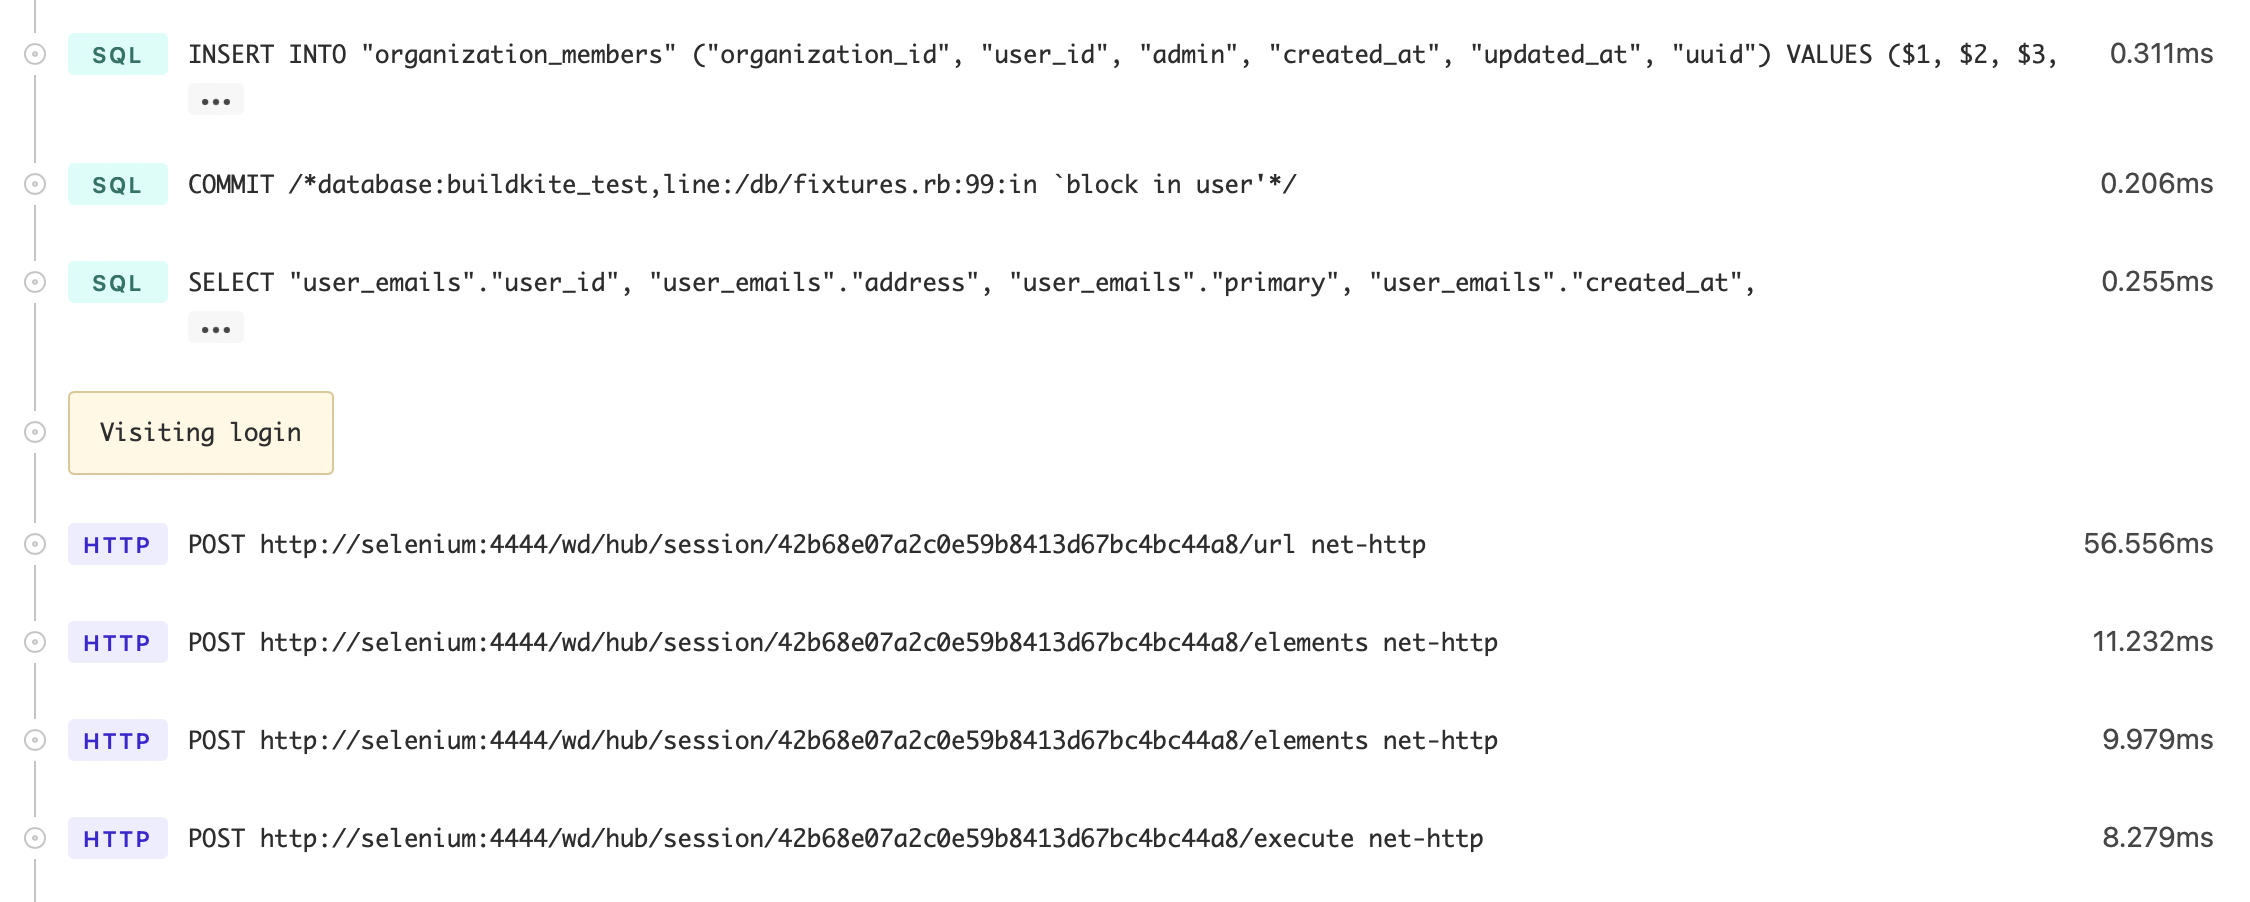
You can also annotate span information to help investigate problems, and see detailed log information inside Test Analytics for any failed test or run.
